The Hetzel Creative Hub
Every client gets access to a live dashboard showing exactly how their marketing is performing — website traffic, local rankings, Google Ads spend, Google Business Profile activity, reviews, and more. Plus a monthly snapshot with our personal notes on what moved and what's next.
You Shouldn't Pay for Marketing You Can't Measure
Hiring a marketing agency without being able to track results is like paying a contractor to remodel your kitchen and never being allowed to see the work. You're just supposed to trust that something happened. We don't operate that way.
Every Hetzel Creative client gets a live dashboard with real data from every channel we manage and a monthly snapshot we personally review and annotate before it lands in your inbox. You always know exactly what your investment is doing.
Live Data, Always Current
Your dashboard pulls real numbers from Google Analytics, Google Ads, your Google Business Profile, and more. What you see is what is actually happening right now.
Every Channel in One Place
Website traffic, local rankings, organic rankings, ad spend, backlinks, page speed, GBP performance, and reviews — all in one login. No chasing down six different tools to get a straight answer.
Tools Built Right In
The Hub isn't just a dashboard — it's where you manage your review generation too. Send review requests, track which team members are collecting reviews, and monitor your review count and rating all in one place.
No Vanity Metrics
We don't hide behind impressions and traffic numbers that look good but don't mean anything. The metrics in your Hub connect directly to calls, leads, and customers.
Lead Tracking
All Your Leads in One Place
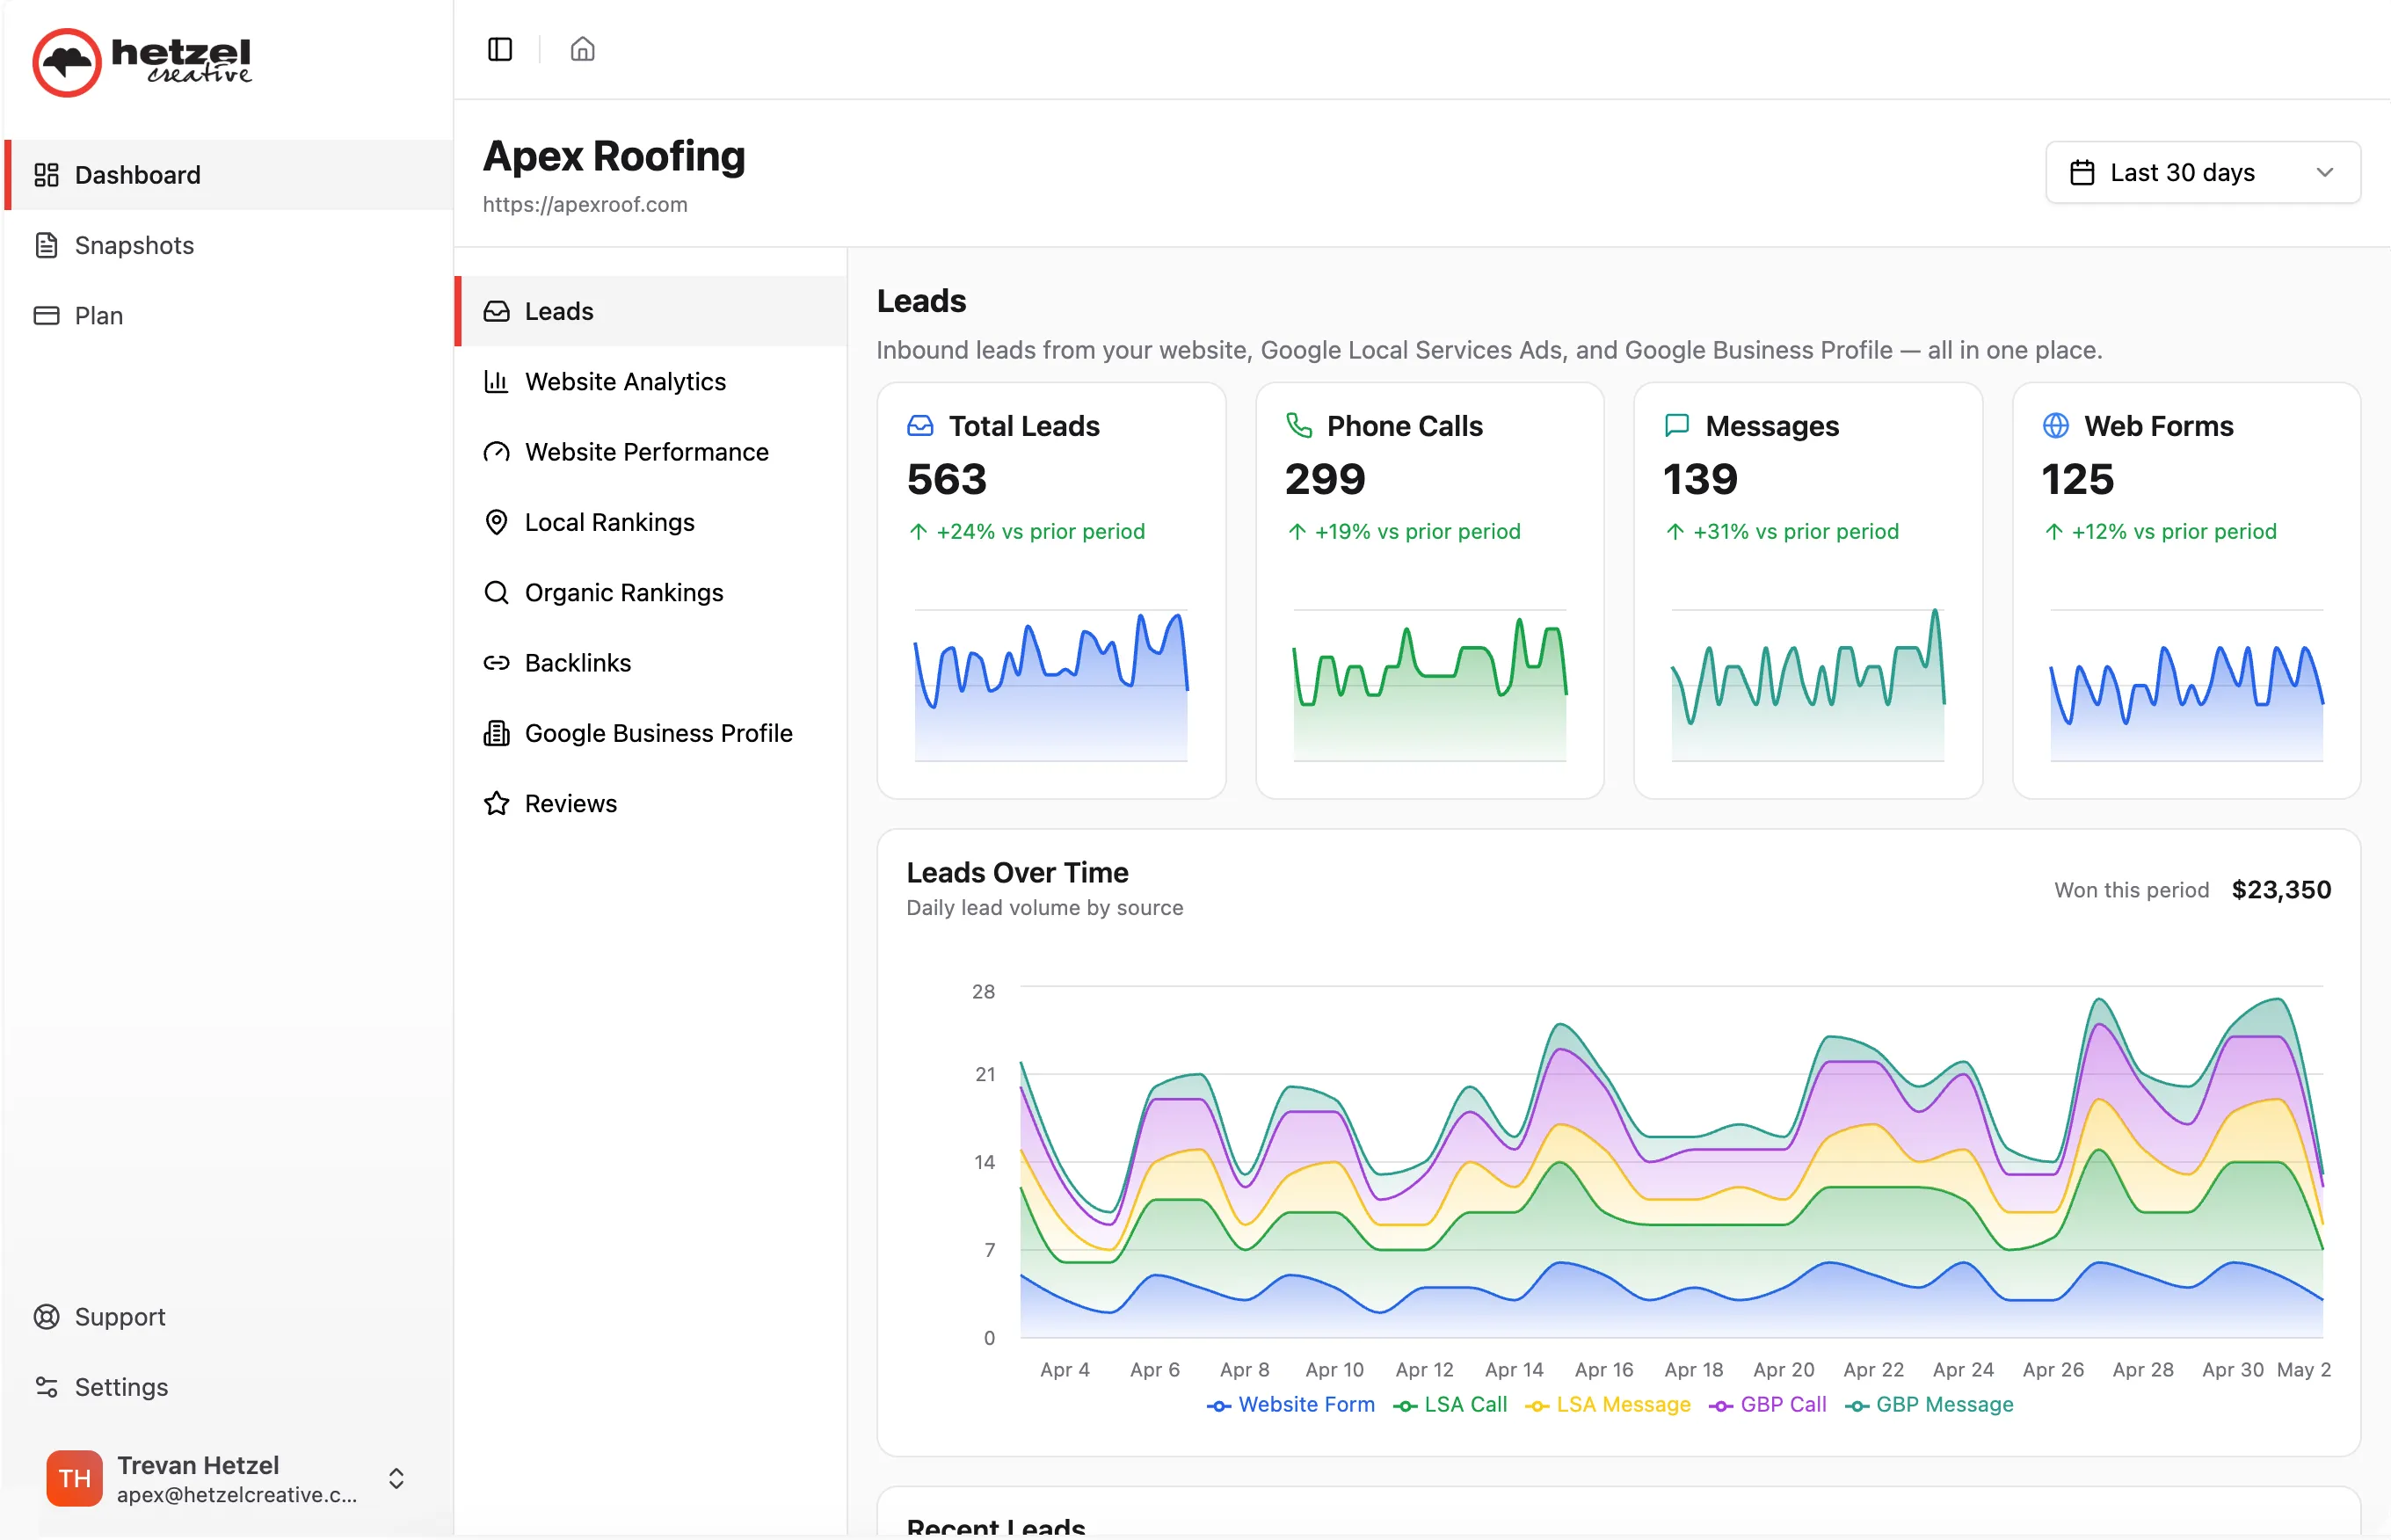
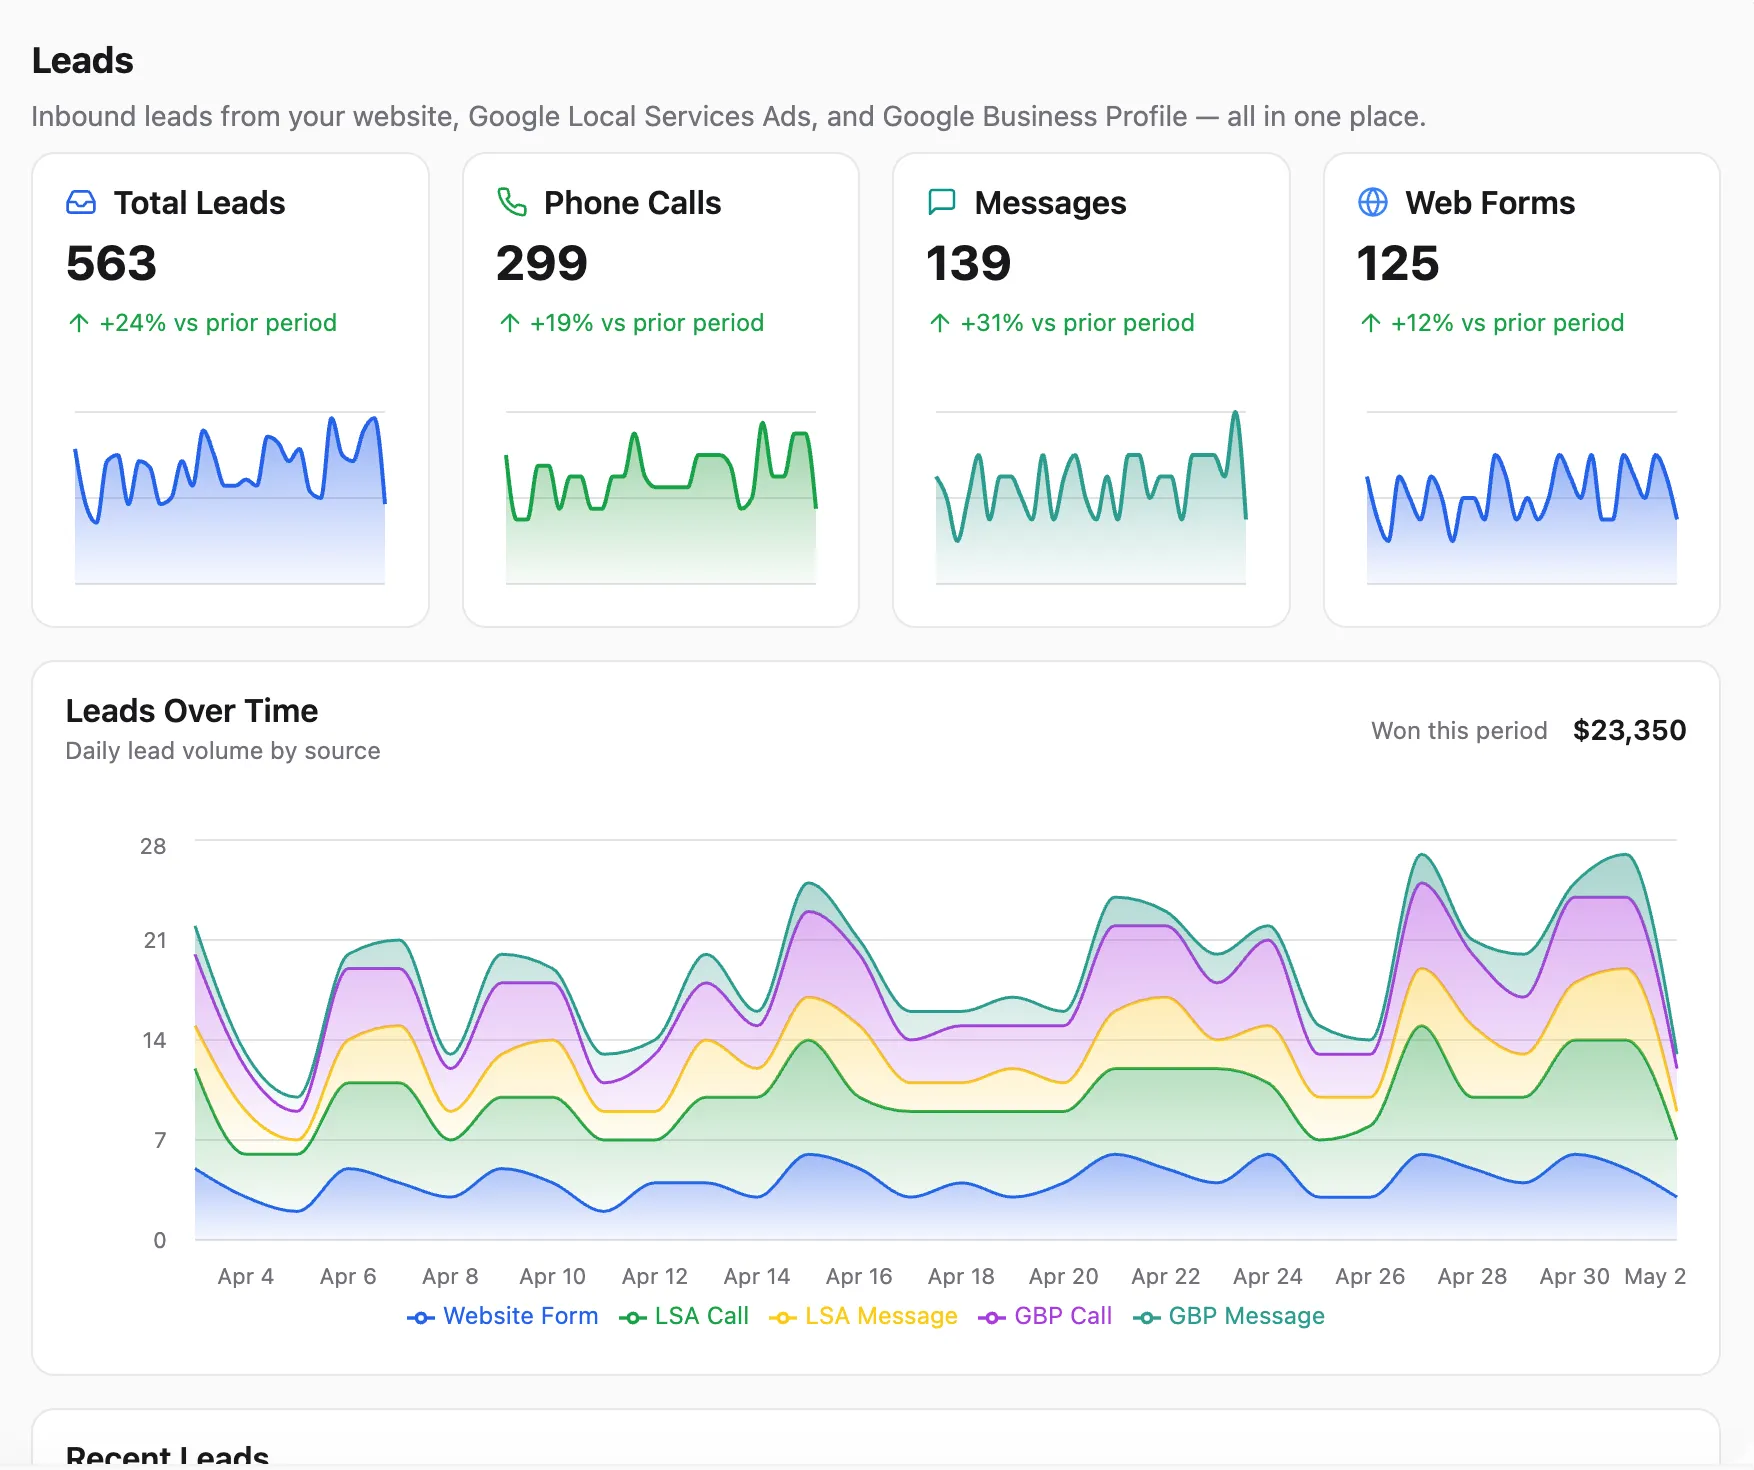
Most business owners have no idea how many leads their marketing is actually generating or where they're coming from. The Hub changes that. Your leads dashboard pulls in every inbound lead across every channel — phone calls, web form submissions, Google Local Services Ads, and Google Business Profile messages — and shows them all in one place.
You can see your total lead volume, how it breaks down by source, and how it's trending compared to the previous period. There's even a revenue tracker — log what an average job is worth and the Hub will estimate the value of the leads coming in each month so you're looking at real dollars, not just call counts.
Local Rankings
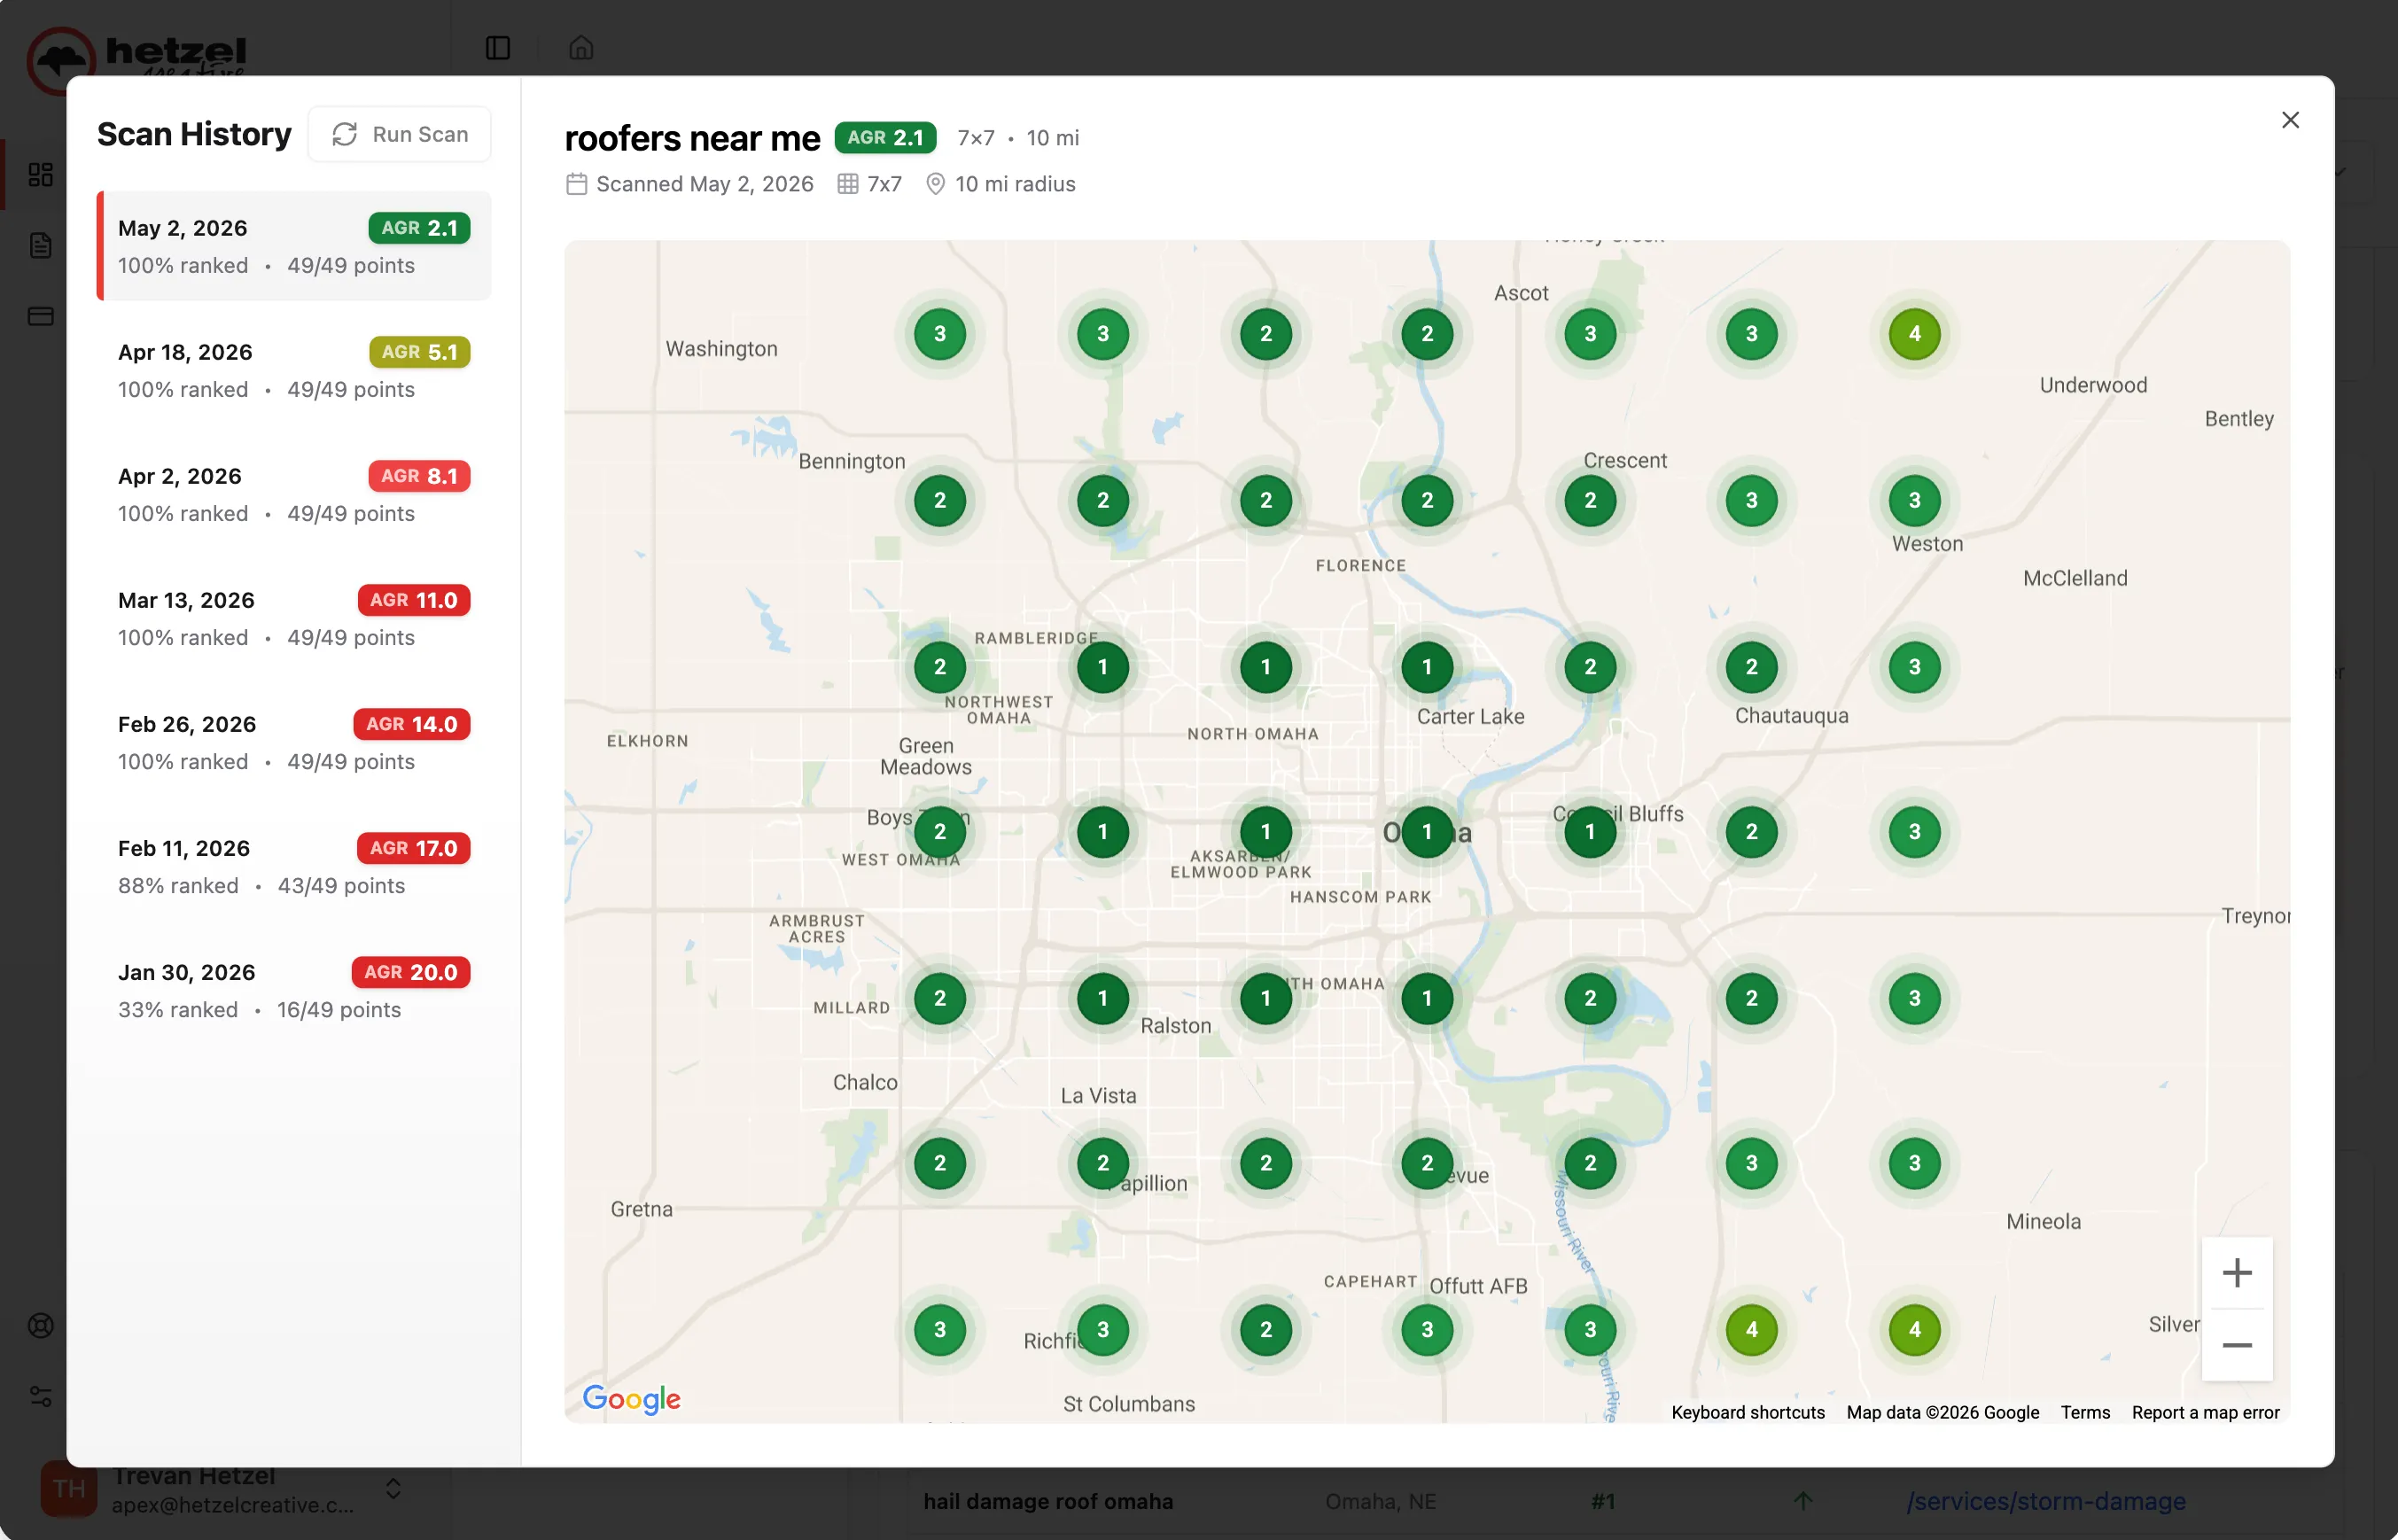
See Exactly Where You Rank, Block By Block
The GeoGrid view maps your local rankings across your service area. Green points mean you're in the top three for that keyword from that exact spot. Red means there is work to do.
We refresh GeoGrids every two weeks so you can watch the map shift as we earn rankings, and so we can target the streets and ZIP codes where you are still weak.
Website Traffic
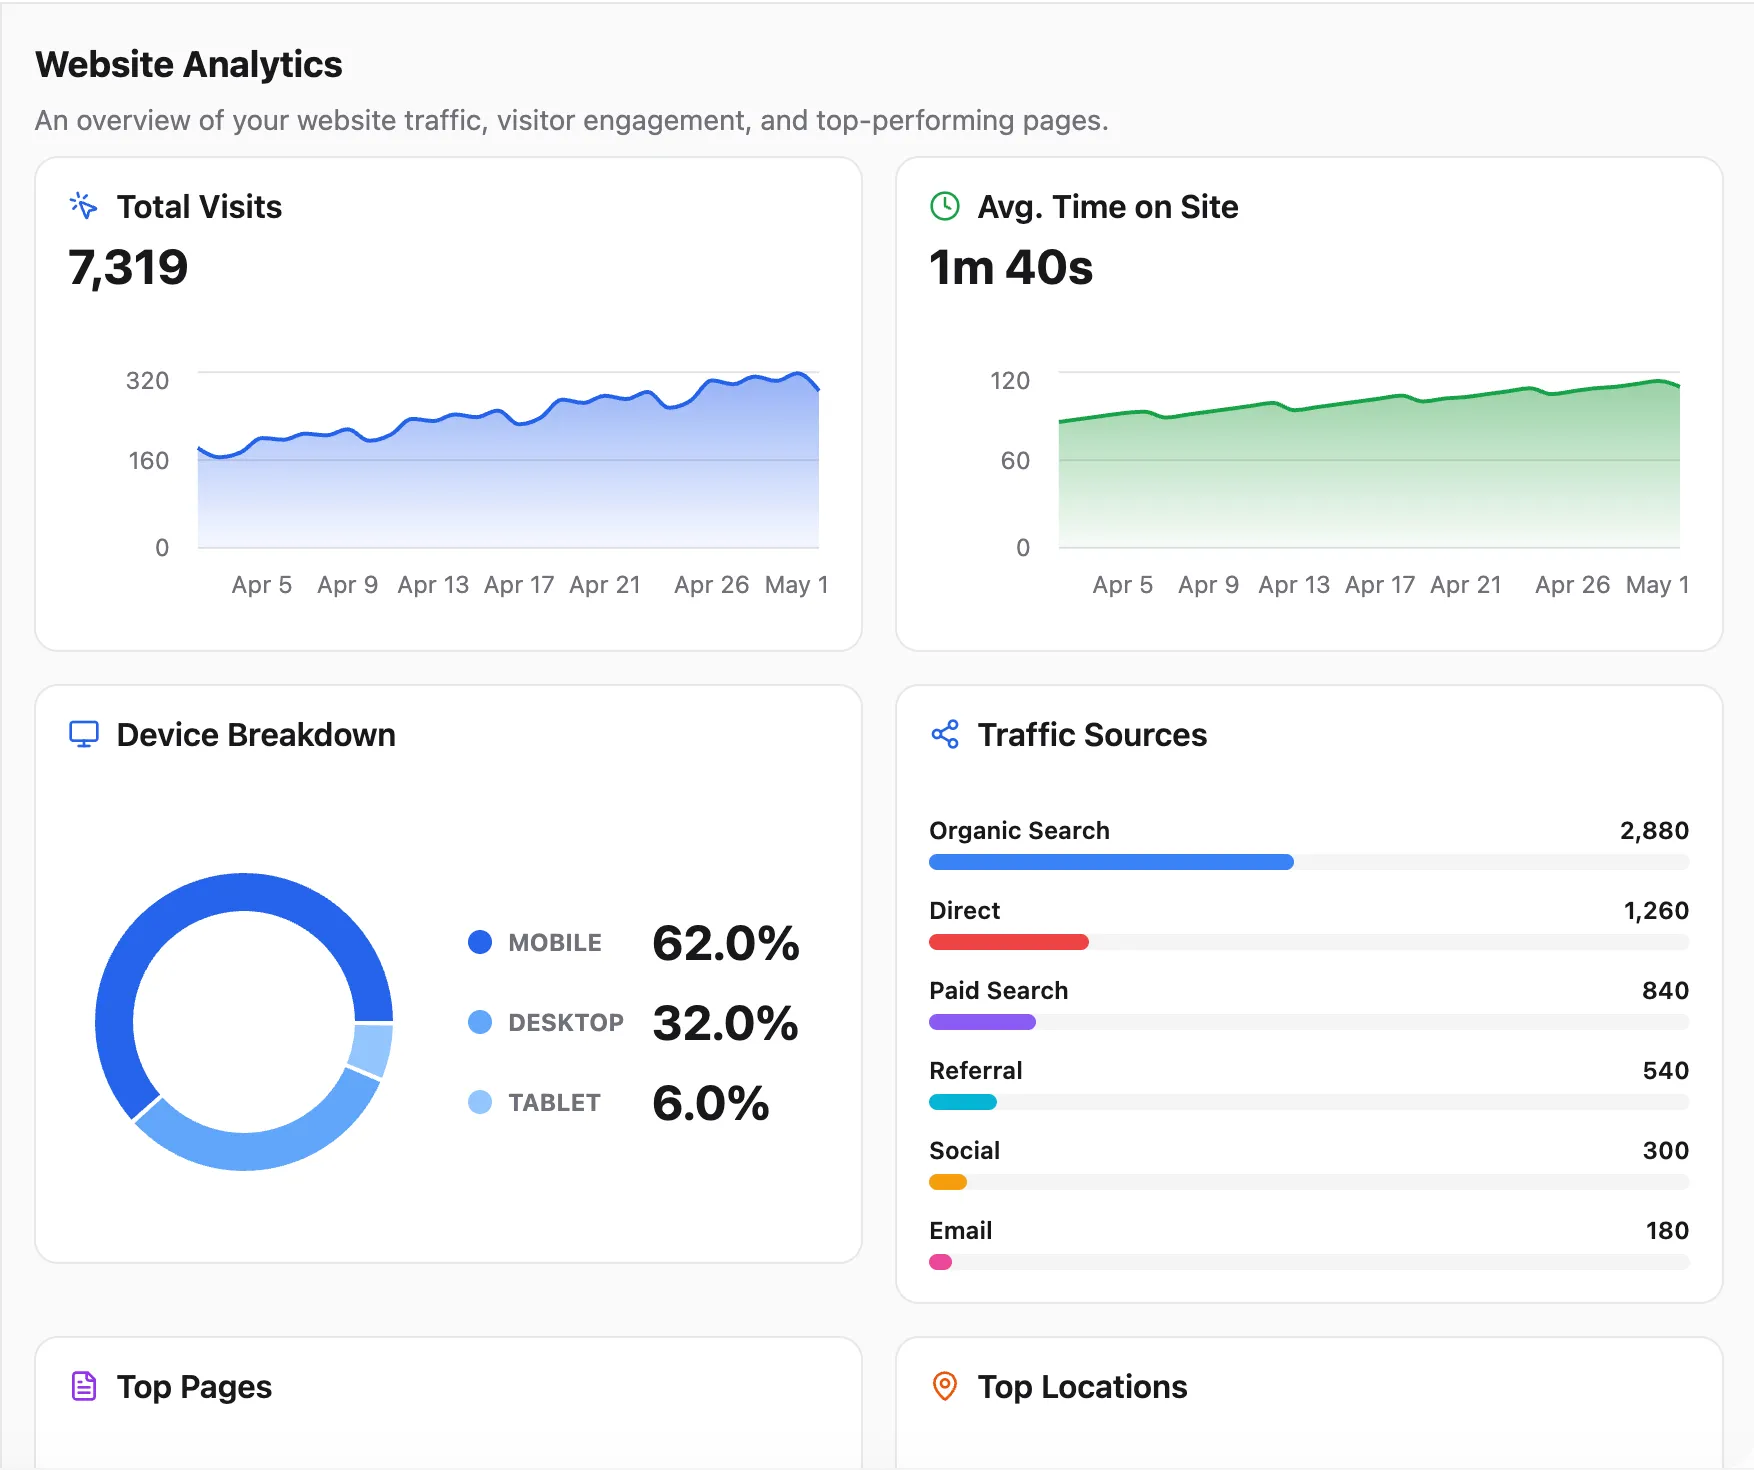
Know Who's Visiting Your Site and Where They're Coming From
Your website is working around the clock to bring in potential customers. The Hub shows you exactly how it's performing — how many people visited, what device they were on, which pages they spent time on, and how they found you in the first place.
Whether traffic is coming from Google search, your ads, direct visits, or referrals from other sites, you can see it broken down clearly without logging into any third-party tool or interpreting a complicated dashboard. Just the numbers that tell you whether your website is doing its job.
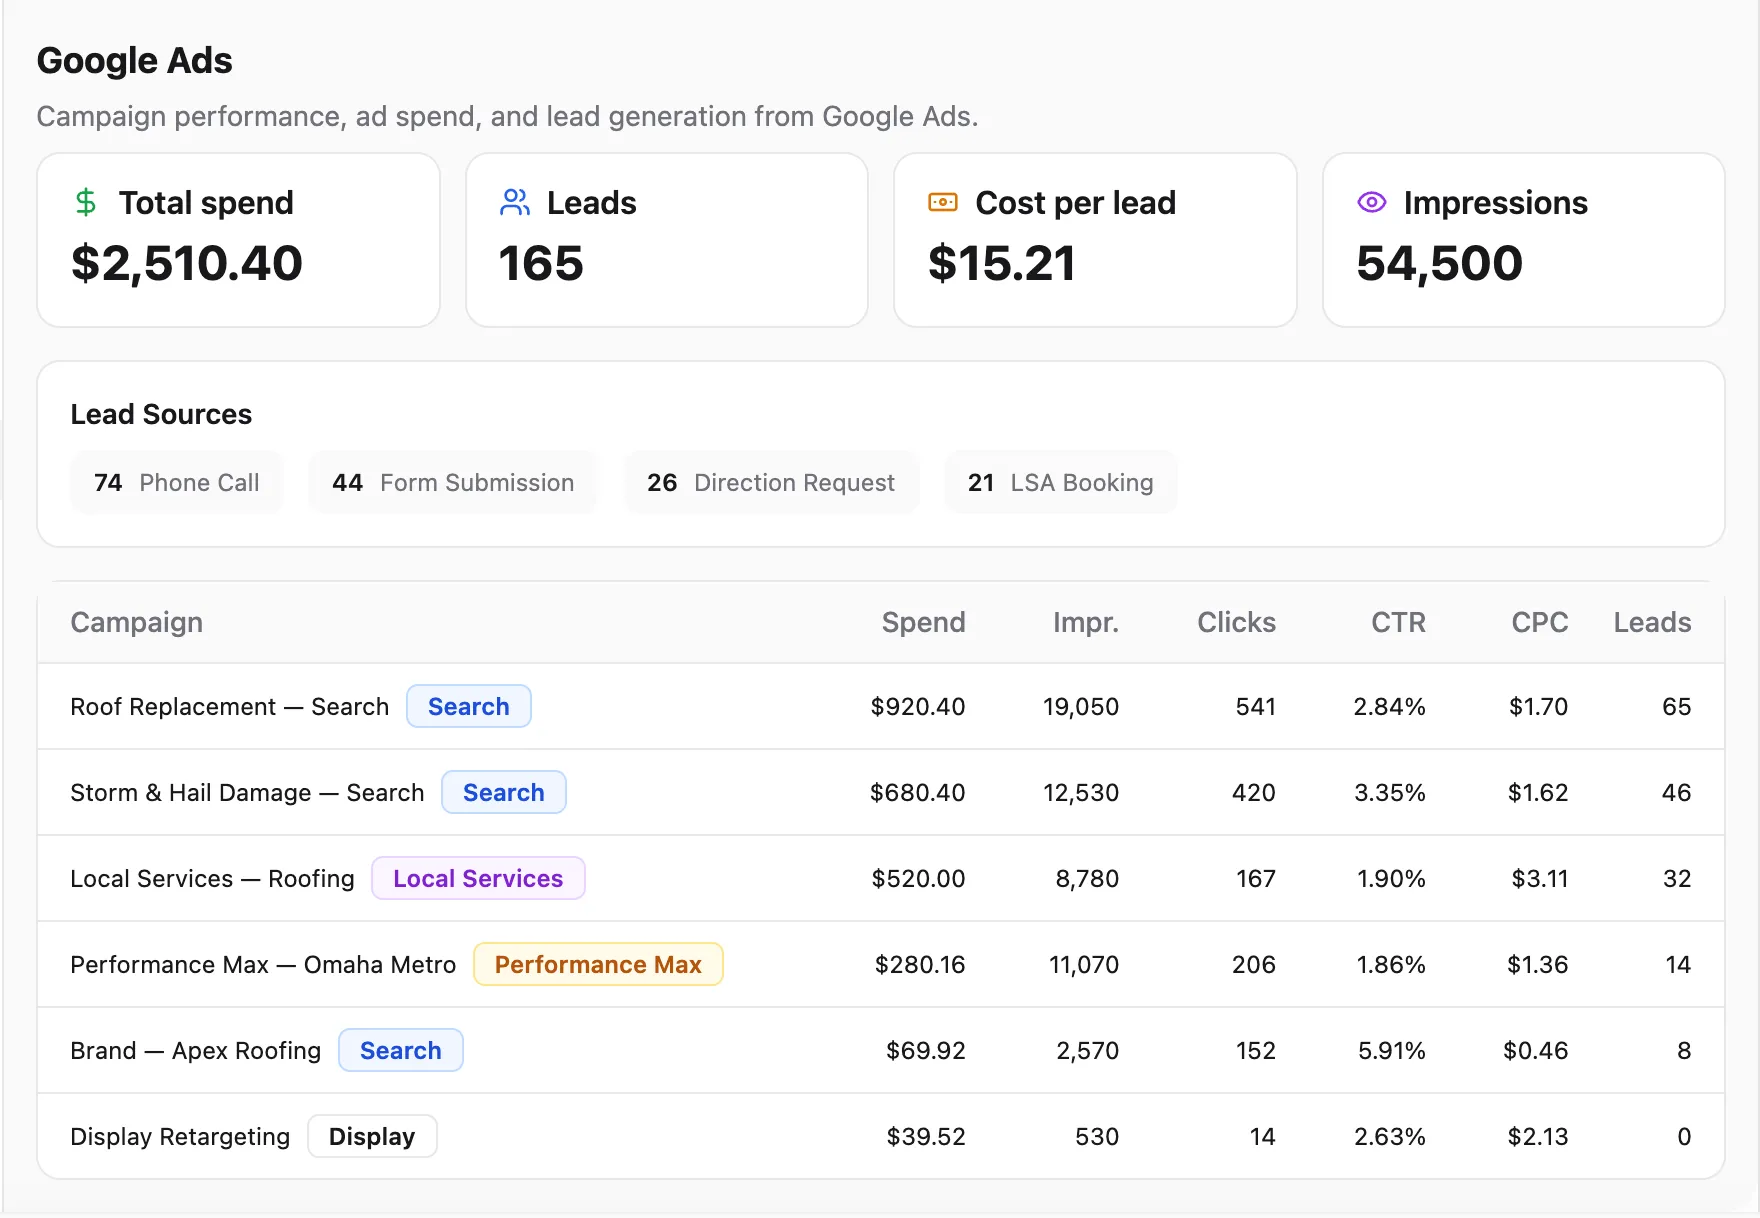
Google Ads
Track Every Dollar You Spend on Ads
Watch your campaigns the same way we do. Daily spend, clicks, conversions, and cost per lead update in real time so you always know what your ad budget is doing.
If a campaign starts spending too fast or a cost per lead is creeping up, you'll see it before our next call — and so will we.
Monthly Snapshot
Your Numbers, In Your Inbox, Every Month
At the beginning of every month we generate your snapshot, go through it ourselves, and add our personal notes before we send it. You're not getting a data dump — you're getting our honest read on what happened, what drove it, and what we're doing next.
But you don't have to wait for the monthly send. Your snapshot is live inside the Hub all month long — filter by date range, drill into specific channels, and interact with the charts whenever you want a closer look.
The snapshot covers
- Website traffic, device breakdown, and traffic sources
- Core Web Vitals and page speed scores
- Local ranking GeoGrids for each tracked keyword
- Organic keyword positions and trend movement
- Total backlinks and domain authority
- Google Business Profile calls, clicks, directions, and impressions
- Review count, average rating, and recent reviews
- Google Ads spend, leads, cost per lead, and campaign breakdown
- Our personal notes on the month and what's coming next
Your April
in numbers.
Strong month — local rankings climbing fast and CPL down a third. Doubling the Ads budget for May.
— Trevan
Transparency Is How We Work
The Hub is always on. You can check in any time you want a read on rankings, traffic, or ad spend. The numbers we reference on calls and in your monthly snapshot are the same ones you see — there is no separate agency view with different data hidden behind the scenes.
That transparency changes the conversation. Instead of wondering whether your marketing is working, you can see it. And instead of us having to defend our work, we spend our time together talking about what to do next.
Want This Kind of Visibility Into Your Own Marketing?
Become a client and you'll have a live dashboard and a personally reviewed monthly snapshot within your first week.